http://waterwatch.usgs.gov/new/?m=real&w=plot&r=nm
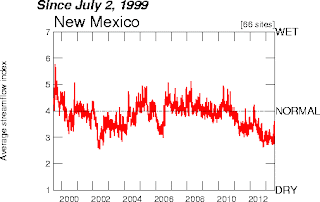
Description: An Index Value Plot is a set of points plotted onto a line graph that shows the variations of a topic over a period of time. This particular plot is on the average streamflow of water in New Mexico since 1999.

No comments:
Post a Comment